Configuring synthetic monitors according to your requirement enhances synthetics security and stabilizes IT operations process flow.
View the Synthetics Resource Details
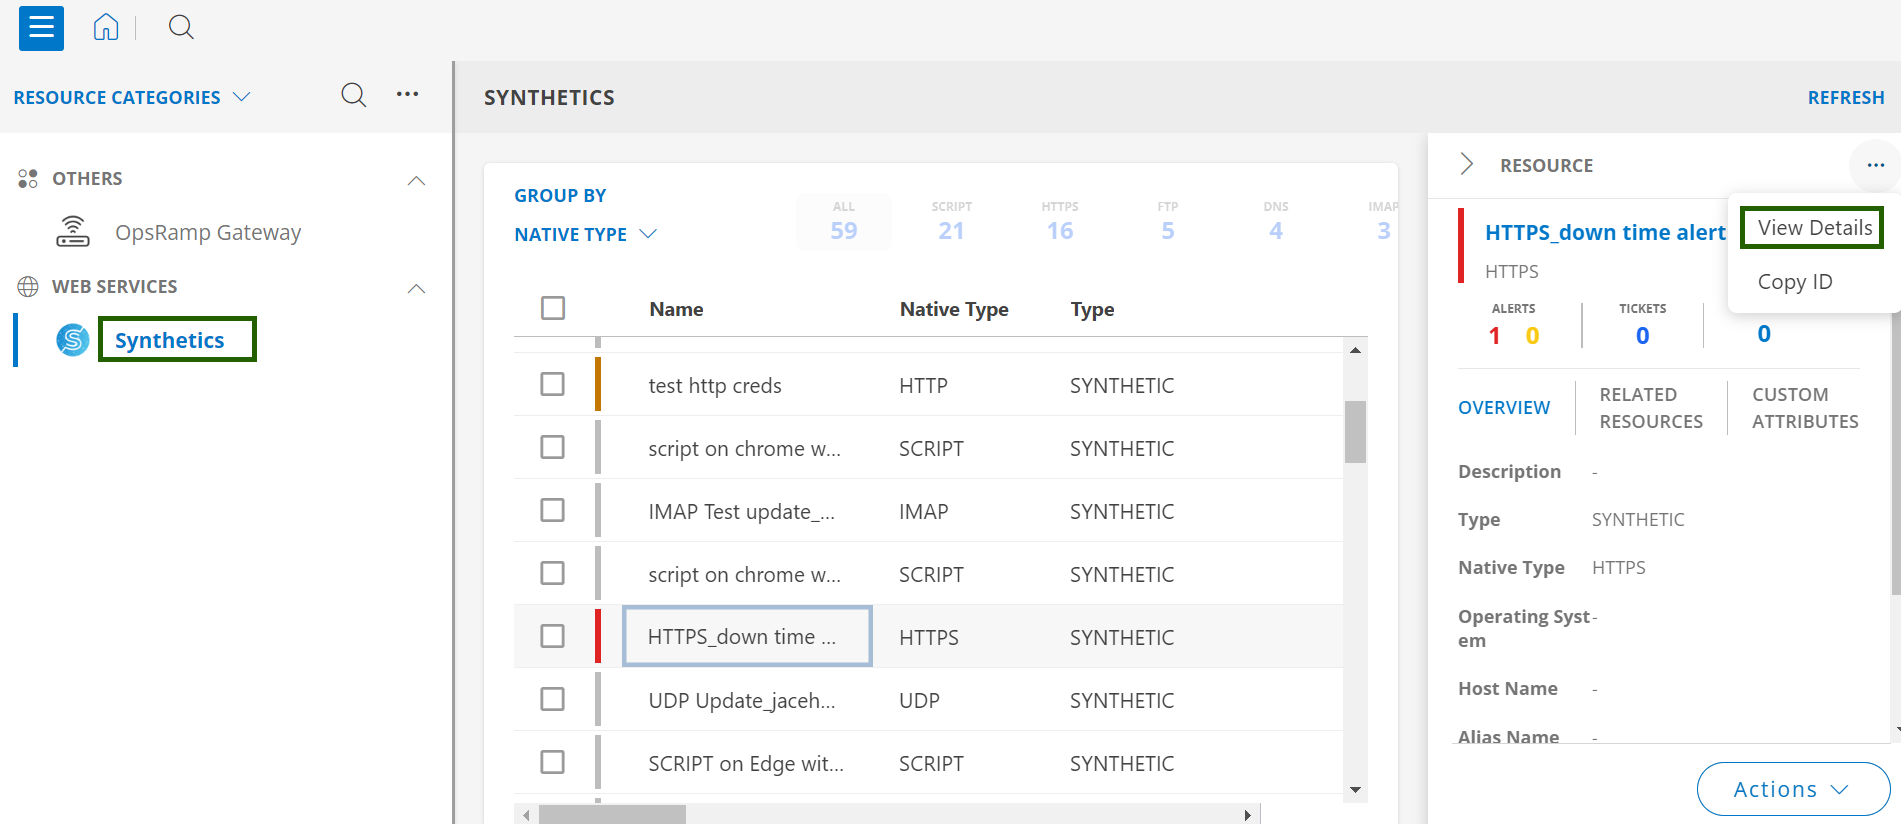
To discover resources for Synthetics Monitor:
- Navigate to Infrastructure > Search.
- Select Web Services > Synthetics.
- Click on the configured Synthetic from the list.
- The RESOURCE slide-out appears on the right panel.
- See the basic details about configured resource.
- To see the details of the resource, click the ellipsis (…) on the top right and then select View Details.
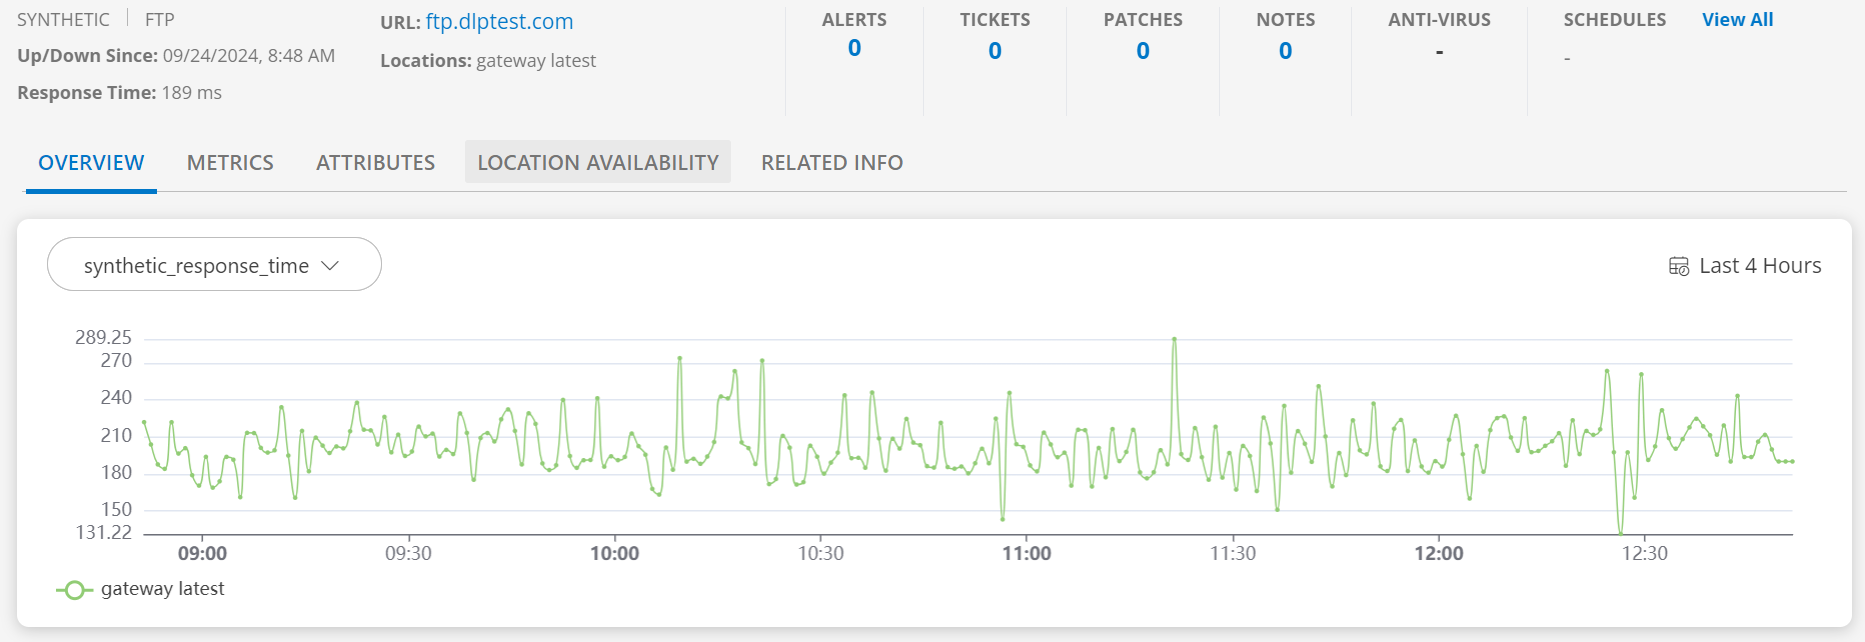
- Overview: A summary of the resource’s status and basic details.
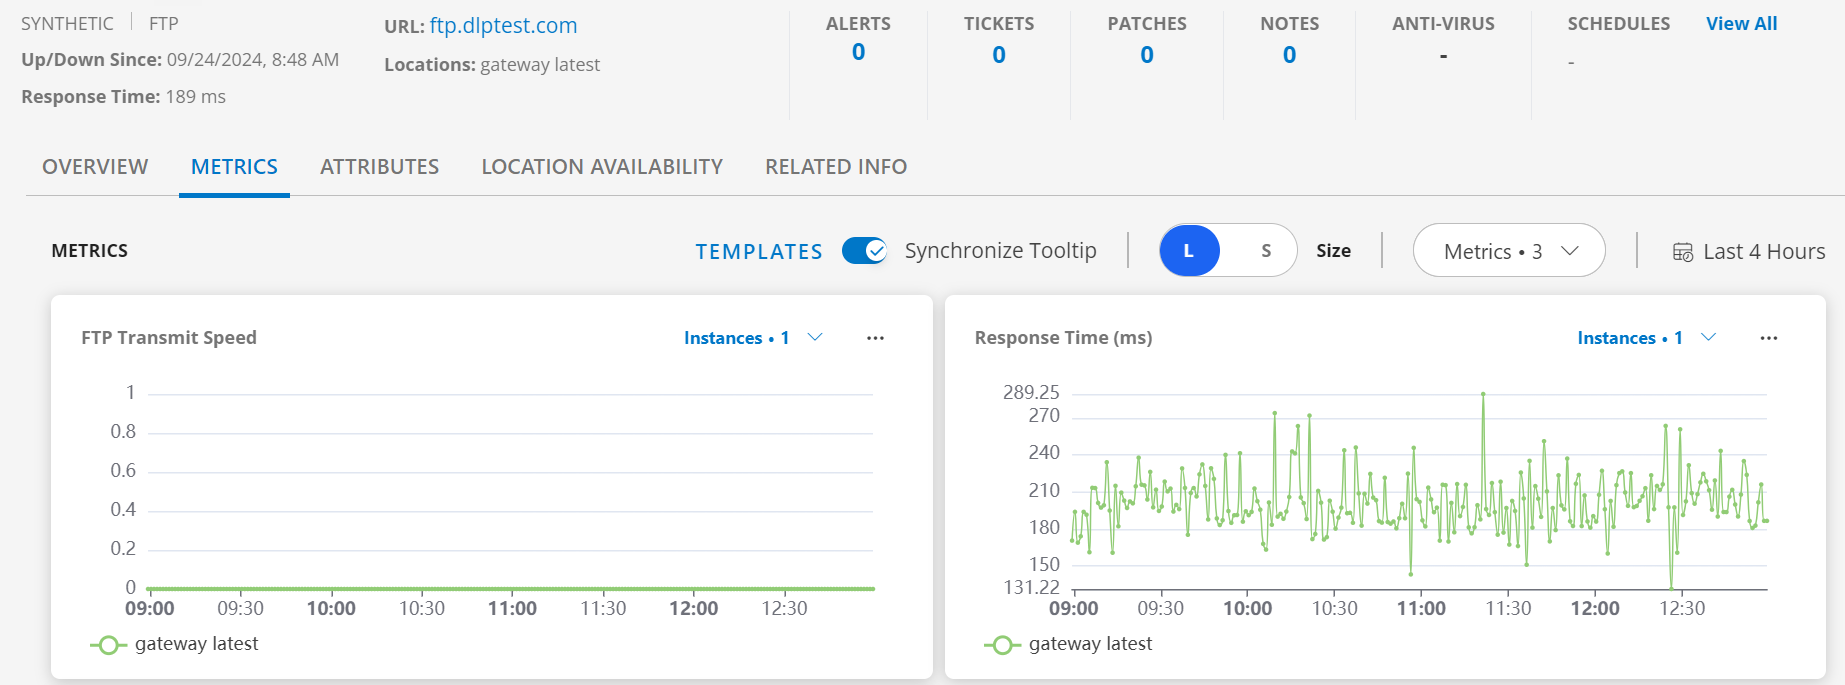
- Metrics: Performance data and key metrics for the resource.
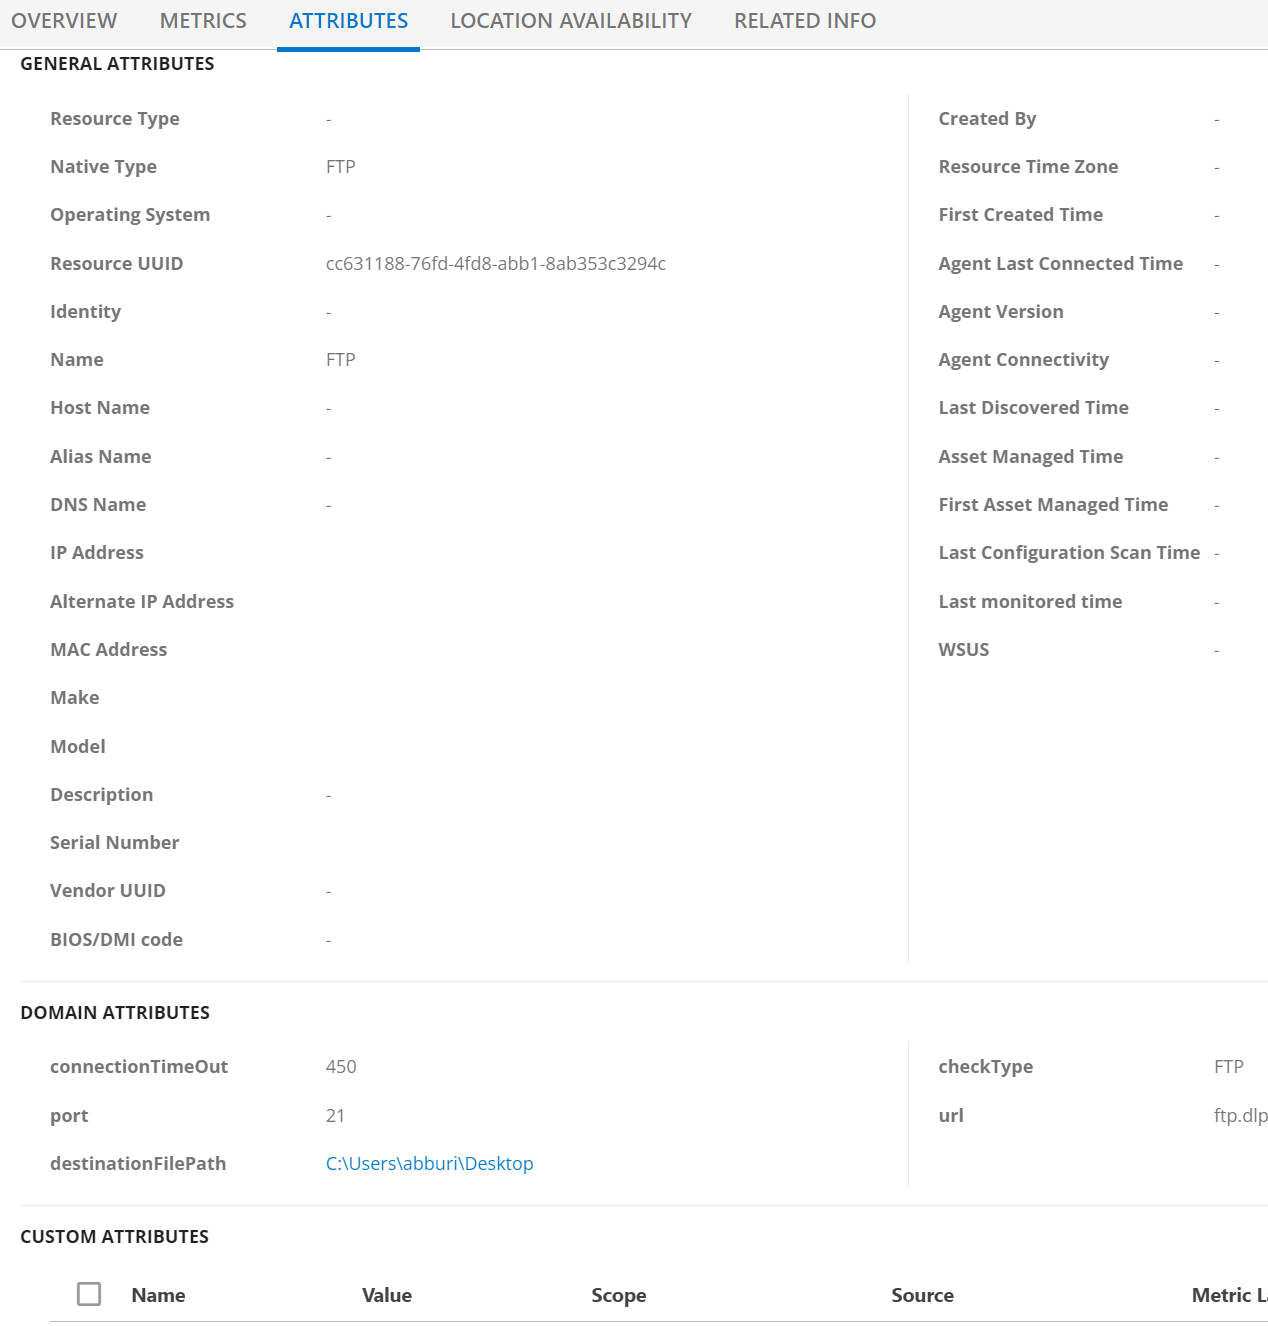
- Attributes: Specific resource properties and configuration details.
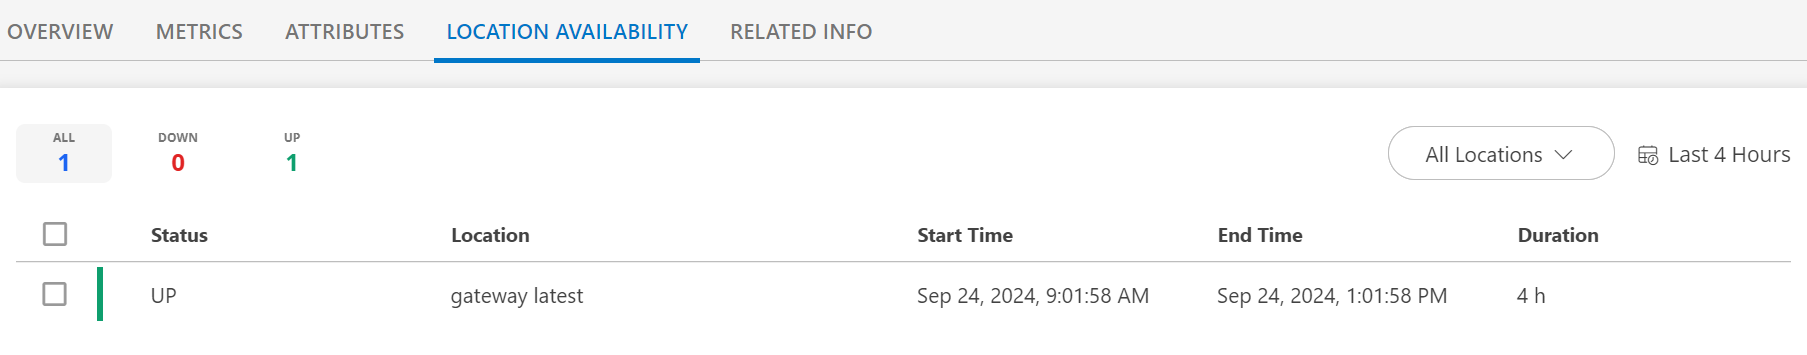
- Location Availability: Geographical location and uptime information.
- Related Info: Additional relevant details and associated data.
Manage the Synthetics Resources
To manage a synthetic resource, click the ACTIONS button and do the following actions:
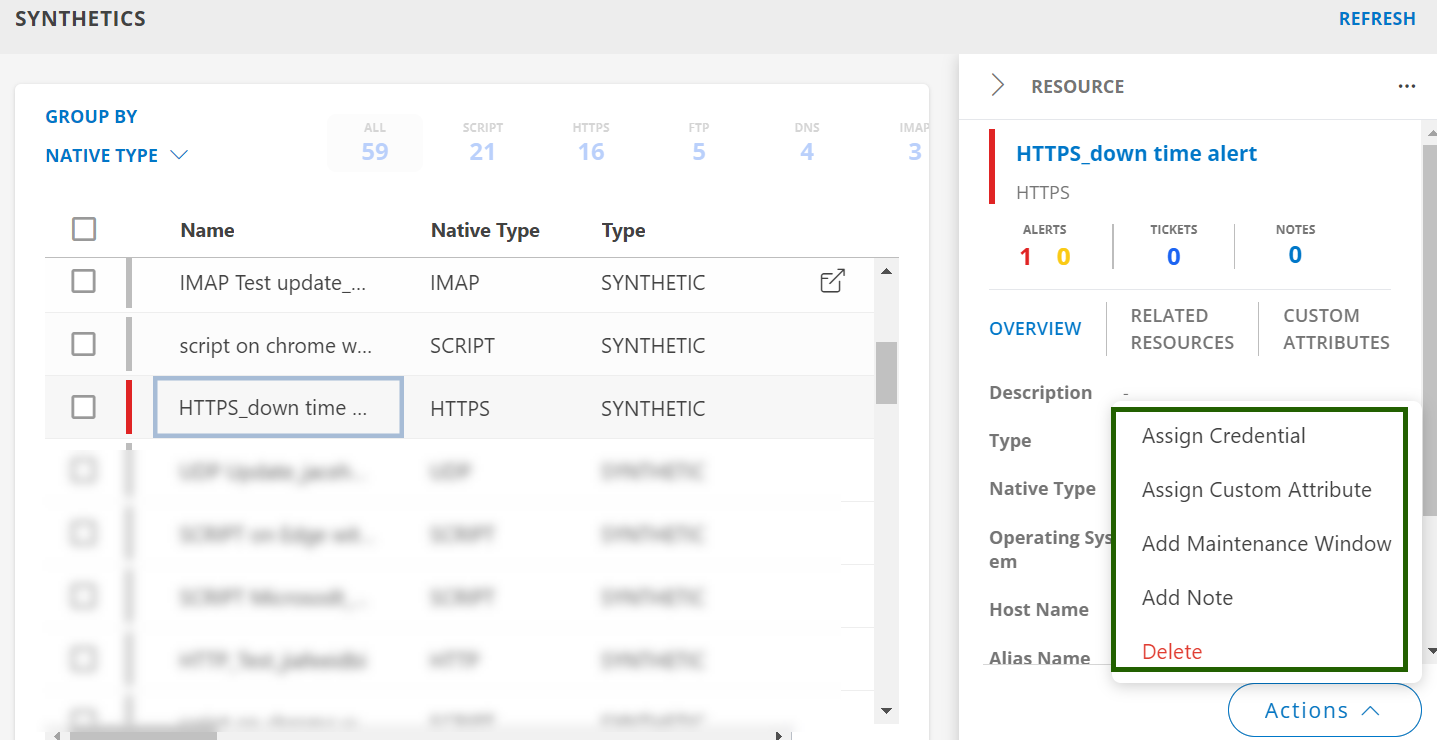
Assign Credentials
You can assign multiple credentials to one or multiple resources.
Prerequisite: User should have Manage_Device and Credentials_Manage permissions to perform this action.
Follow these steps to add credential(s):
- From the Actions menu, select Assign Credential.
- From the Assign Credential popup that shows the selected resources, select the credential(s) from the list of credentials that are available under the client.
Note: You can select up to five credentials at a time. - Click the Assign Credential button to assign the credential(s) to the resource(s).
Note: The maximum resources that you can select is 50 at a time.
A message appears if the number of resources that are selected increases the limit.
You can deselect the resources from the list box.
Assign Custom Attributes
You can assign custom attribute to one or multiple resources.
Follow these steps to assign custom attribute to multiple resources:
- From the Actions menu, select Assign Custom Attribute.
- From the Assign Custom Attribute popup that shows the selected resources.
- Select the custom attribute Name and the Value from dropdown lists.
- Click the ASSIGN CUSTOM ATTRIBUTE button to assign the custom attribute to the resource(s). A success message appears.
You can also use the resource slide-out to assign custom attribute to a resource:
- Once you have searched for resources using step#2 above, you can use the filter criteria or the search box to search for the specific resource.
- Click anywhere on the search result.
- From the resource slide-out, click Actions > Assign Custom Attribute.
- Follow steps 2 to 3 above. The custom attribute is assigned to the resource, and a success message appears.
Add Maintenance Window
You can schedule a maintenance period on one or multiple resources.
To add maintenance Window for a synthetic monitor, follow these steps:
- From the Actions menu, select Add Maintenance Window.
- From the Add Maintenance Window popup, enter the following details:
- Name: Enter a name.
- Description: Provide a description.
- Schedule: Select One Time, Daily, Weekly, or Monthly.
- Select the settings:
| Setting | Description |
|---|---|
| Run RBA scripts during this window | Check to run RBA scripts during maintenance. |
| Install patches during this window | Check to install patches during maintenance. |
| Correlate all open alerts when window ends | Optionally check to correlate alerts after maintenance. |
| Escalate maintenance alerts when window ends | Optionally check to escalate alerts after maintenance. |
| Define alert criteria for maintenance alert | Optionally check and define criteria for maintenance alerts. |
- Click ADD MAINTENANCE to save.
Add a Note
You can add a note to one or multiple resources.
Follow these steps to add a note:
- From the Actions menu, select Add Note.
- From the Add Note popup that shows the selected resources.
- Enter the Subject and Description.
- Set the validity for the note from the calendar.
- Click the Add Note button to add the note.
Note: The maximum resources that you can select is 50 at a time.
A message appears if the number of resources that are selected increases the limit.
You can deselect the resources from the list box.
Delete Resources
Follow these steps to delete resource(s):
- From the Actions menu, select Delete.
- From the Delete Resources popup, click Delete.
Note: The maximum resources that you can select is 40 at a time.
A message appears if the number of resources that are selected increases the limit.
You can deselect the resources from the list box.
Note
Deleting a Synthetics Integration Configuration automatically removes its associated resource, but removing a resource from the Resource page does not delete the Integration configuration and it remains in the system.Copy ID
Click the three dots available for the resource and click Copy Id. The resource id is copied.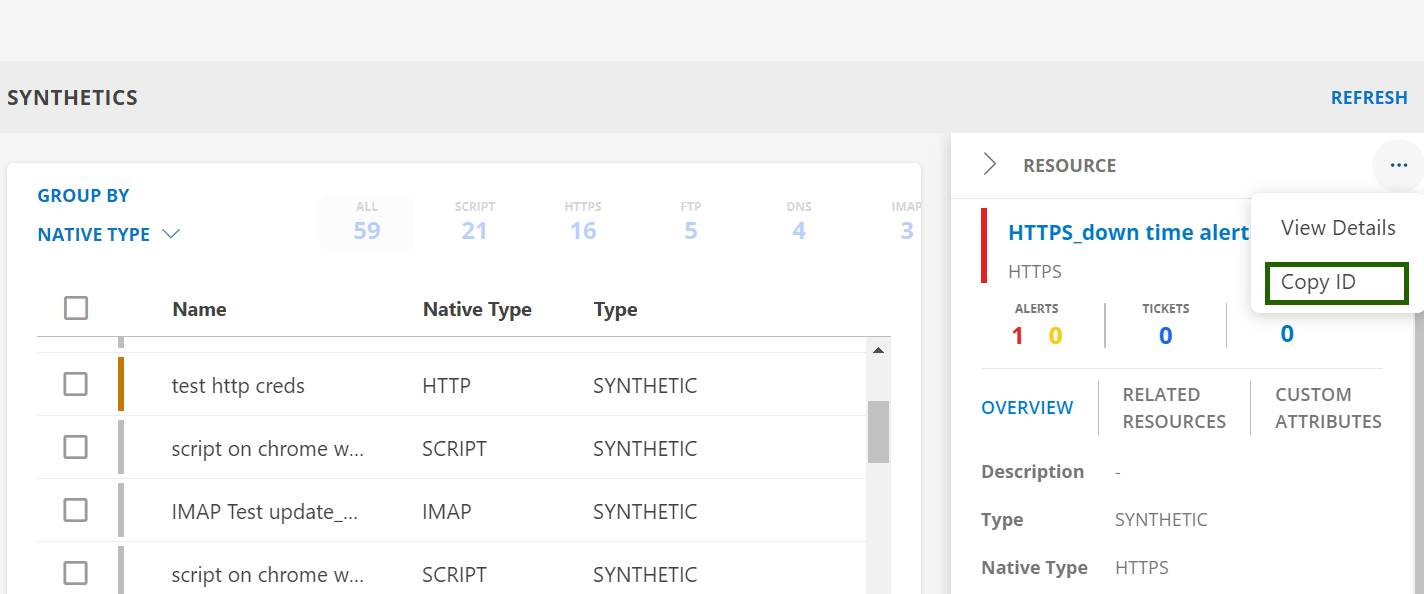
View/Configure Alerting Thresholds
To view the alert thresholds for a specific synthetic resource:
- Navigate to Infrastructure > Search.
- Select Web Services > Synthetics.
- Choose the desired synthetic resource.
- The Resource slide-out appears on the right panel.
- Click the ellipsis (…) button and select View Details.
- The resource details page will display. Click Metric > Templates.

- Click the dropdown arrow on a template and click View Template Details icon.
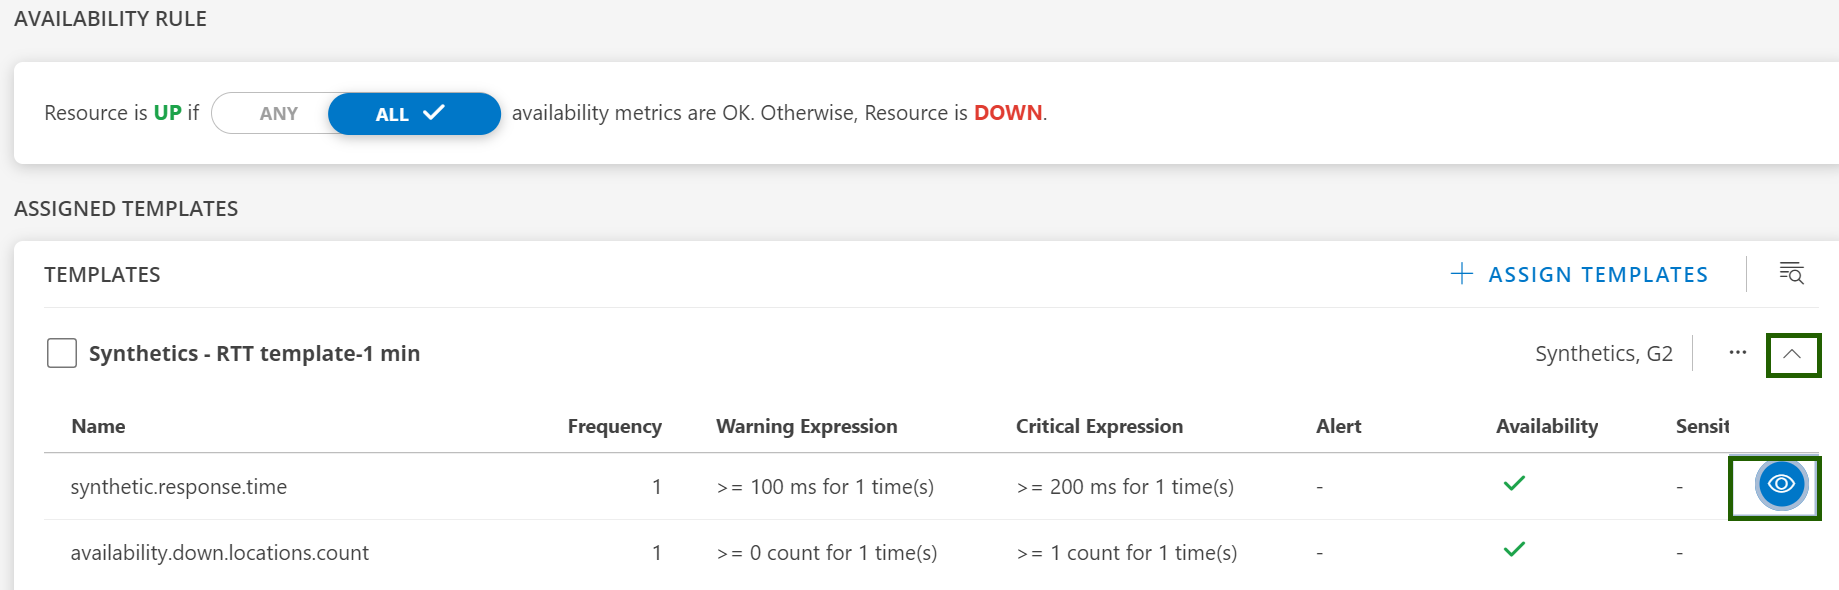
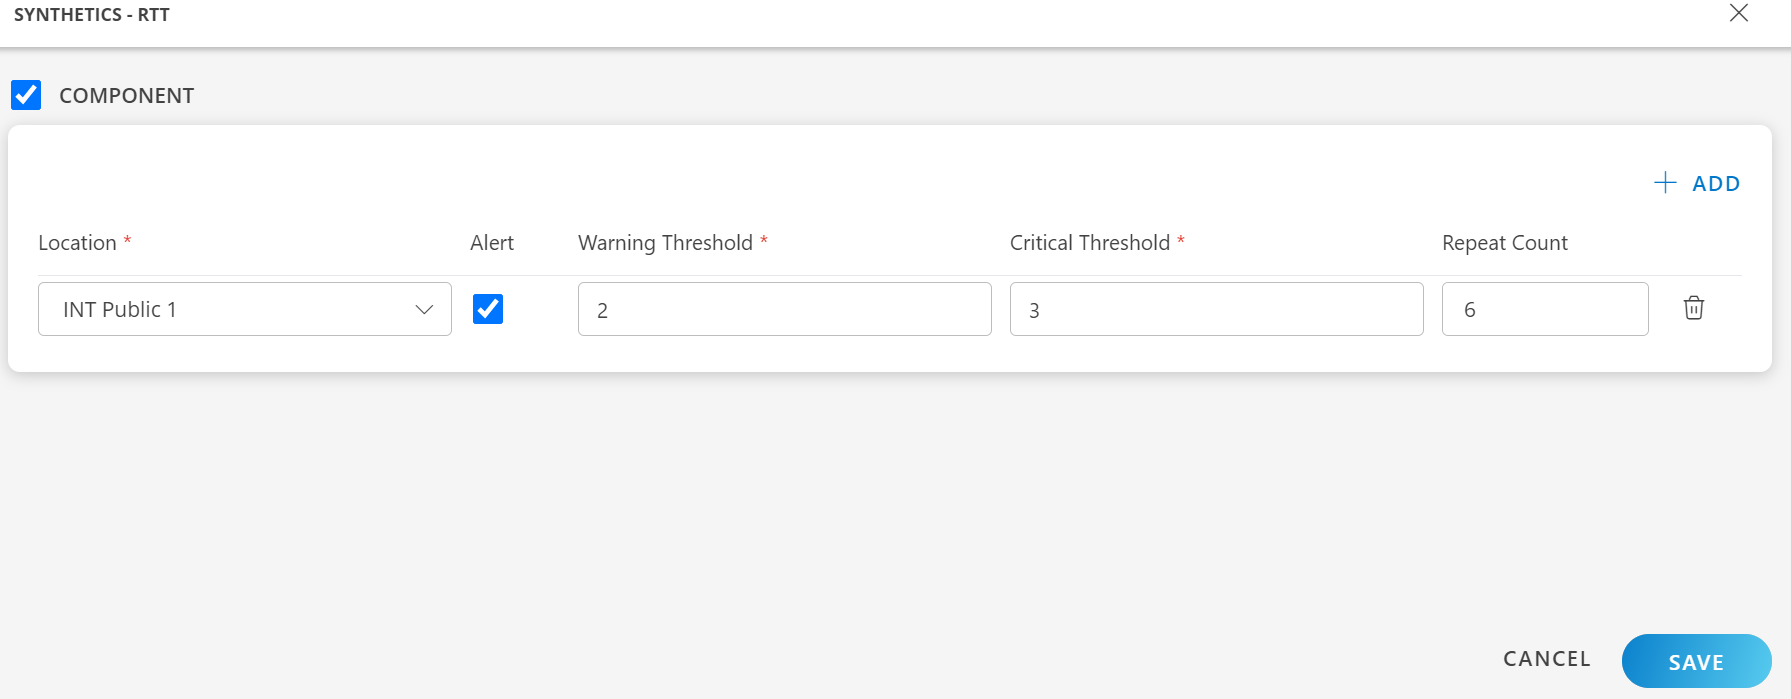
- Configure the following settings and click Save.
- Location: Specify the location for the alert.
- Alert: Enable the alert checkbox to receive notifications.
- Warning Threshold: Set the warning threshold value.
- Critical Threshold: Set the critical threshold value.
- Repeat Count: Specify the number of consecutive occurrences required to trigger an alert.
RCA for Synthetics Resources
What is RCA in Synthetics Resources?
Root Cause Analysis (RCA) helps identify the underlying reasons for issues detected in synthetic monitoring resources. It provides detailed insights to help users quickly understand why a synthetic service might be experiencing problems.
How to Access RCA Details?
- Navigate to Infrastructure > Search > Web Services > Synthetics.
- Search for the specific synthetic resources you want to investigate.
- Go to the Location Availability tab.
- Look for any services marked as Down.
- If any services are down, an icon will appear next to the resource.

- Click the icon to open a new tab displaying detailed RCA information.

RCA Details Explained:
In the RCA tab, you may find the following details based on synthetic type, which can help you to diagnose and troubleshoot the issue:
| Field | Description |
|---|---|
| RCA Instances | All RCA events related to the resource, with the latest RCA shown as RCA 1. |
| Down Time | Duration for which the service has been down. |
| Analysis Triggered By | Entity or system that initiated the RCA. |
| Analysis Started Time | Timestamp when the RCA began. |
| Initial Validation | Preliminary check results. |
| Test Status | Status of the synthetic test. |
| Elapsed Time | Time taken for the analysis. |
| Error Log | Logs related to errors encountered. |
| Trace Route Test | Network route details during the test. |
| HTTP Test Status | Result of the HTTP test. |
| URL | The endpoint being tested. |
| Method | HTTP method used (GET, POST, etc.). |
| Status Code | HTTP response status code. |
| Response Headers | Headers received in the response. |
| Raw Data Response | Complete raw response data for in-depth analysis. |
| Error Screenshot | Captured at the exact moment the error occurred during the current iteration. |
| Previous Success Screenshot | Captured from the last successful run of the same check, useful for comparison when diagnosing the current issue. |